Dashboard
Request Logs
Monitor every CDN and API request in real time.
app.cdnzero.com
What's logged
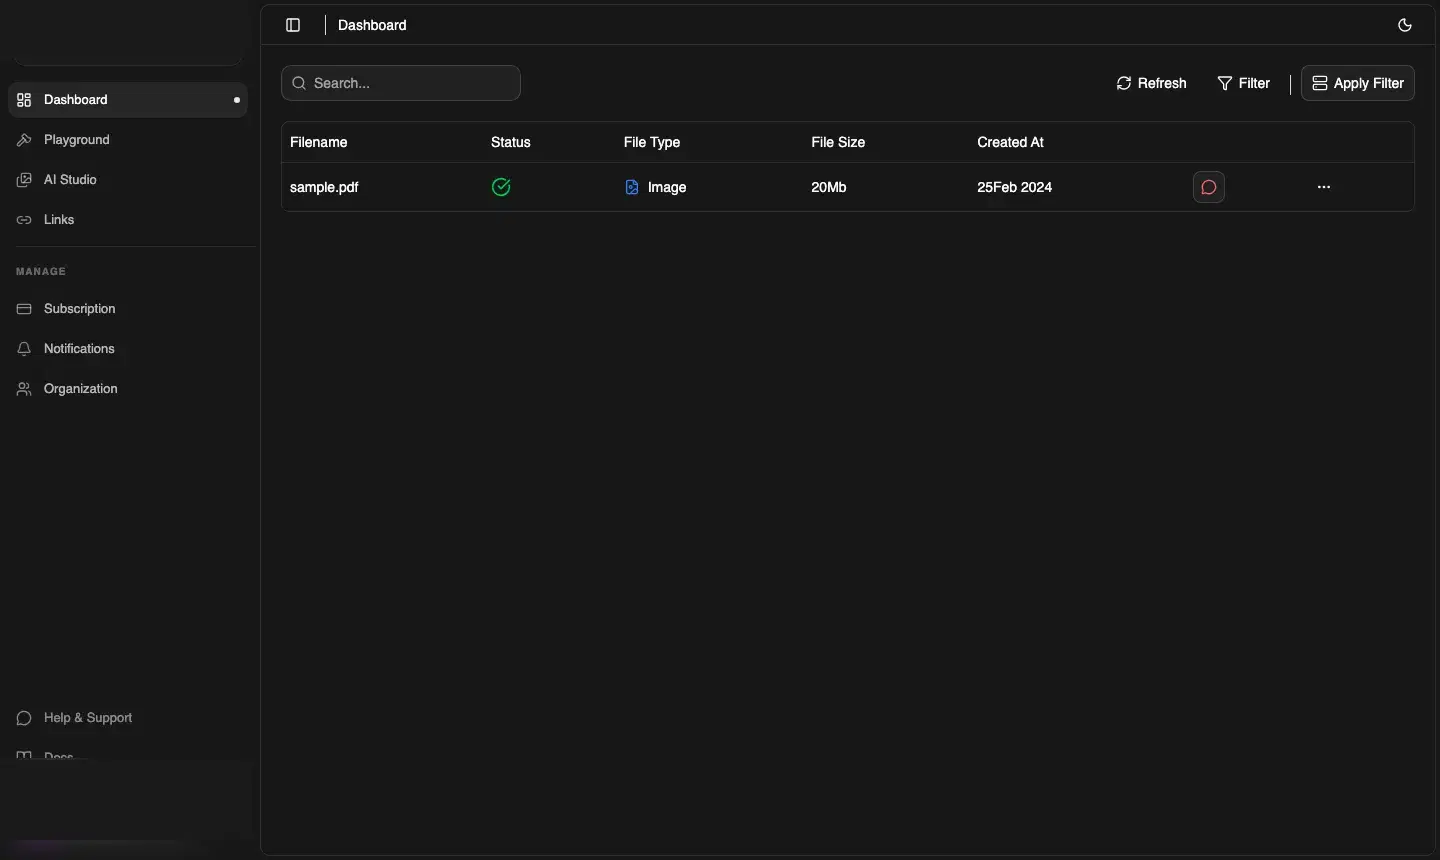
The Logs page shows a table of requests made to your CDNZero storage and API. Each row includes:
| Column | Description |
|---|---|
| Filename | The file or resource that was accessed |
| Status | Request outcome — a green check means successful delivery |
| File Type | Type of asset served (Image, Video, Document, etc.) |
| File Size | Size of the payload delivered |
| Created At | Timestamp of the request |
Filtering and search
Use the toolbar to narrow down logs:
- Search — filter by filename or path
- Filter — apply filters by file type or status
- Apply Filter — confirm and run the filter
- Refresh — reload to see the latest requests
Common use cases
- Debugging broken assets — spot 404s for files that have been deleted or moved
- Monitoring traffic spikes — see which files are getting hit unexpectedly
- Audit trail — confirm when a specific file was delivered and at what size